
Image Source: International Bottled Water Association (IBWA)
A new national survey conducted online by The Harris Poll on behalf of the International Bottled Water Association (IBWA) reveals that 88% of Americans drink bottled water, with 87% viewing it as a positive beverage choice. Water continues to dominate consumer preferences, with nearly 9 in 10 Americans (89%) ranking water — in any form, such as bottled, filtered, or tap — as one of their top beverages.
Americans’ love for bottled water does not seem to show any signs of slowing down. With 69% of Americans ranking bottled water (both still and sparkling, flavored and unflavored) among their top non-alcoholic drinks, this convenient, healthy option is outpacing soda (61%) and coffee (60%). According to the Beverage Marketing Corporation (BMC), bottled water has maintained its position as America’s top-selling beverage for the past eight years, and projections indicate it will continue to lead through 2024.
“According to BMC, people are increasingly choosing beverages with fewer calories, so they are shifting away from less healthy packaged drinks and are choosing the healthiest option — bottled water,” said Jill Culora, IBWA’s vice president of communications in a recent press release. “People who make this switch are also helping the environment because not only are bottled water containers 100% recyclable (including the cap), but they also use much less plastic than soda and other packaged beverages.”
Wherever other drinks are sold, nine out of 10 Americans (90%) say bottled water should be available.
When bottled water isn’t available, however, 68% of those who prefer bottled water would choose another packaged drink instead. Their top alternatives include:
- Soda: 18%
- Sports drinks: 7%
- Tea: 7%
- Juice/fruit drinks: 6%
- Sparkling bottled water: 6%
- Functional water: 5%
- Coffee: 5%
- Sweetened bottled water: 4%
- Bottled tea: 4%
- Energy drinks: 4%
- Flavored bottled water: 2%
- Other: 1%
Meanwhile, 1% of people say they would just stay thirsty.
The remaining 31% would find water from other sources:
- 10% choosing filtered tap water
- 11% using a water cooler
- 6% drinking regular tap water
- 5% using a drinking fountain
In terms of water habits, 11% of Americans only drink tap or filtered tap water, while 18% drink only bottled water. Most people (71%) drink both. Among bottled water drinkers with a packaging preference, 75% prefer plastic bottles, 16% prefer glass, 6% choose metal cans, and 3% opt for cartons. (Note: The figures do not add up to exactly 100% due to rounding.)
When choosing the type of bottled water consumers want to purchase, they prioritize taste (97%), quality (95%), and safety (90%). Convenience is also key, with 82% liking that it’s ready to enjoy, 81% valuing on-the-go packaging, and 79% appreciating re-sealable containers.
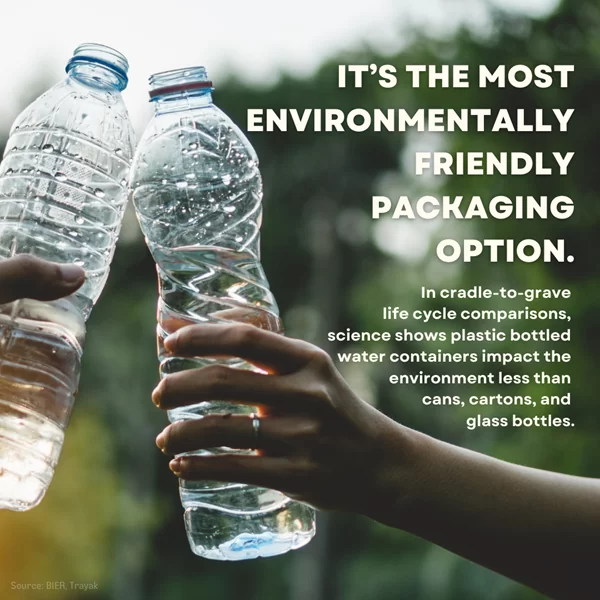
Image Source: International Bottled Water Association (IBWA)
Of bottled water drinkers with a packaging preference (88%), most prefer plastic bottles (75%). Smaller groups prefer glass (16%), metal cans (6%), and cartons (3%). This has interesting environmental implications because bottled water containers use much less plastic than soda bottles. For instance, a 16.9-ounce bottle of water uses about one-third less plastic (8.3 grams vs. 23.9 grams). This is because soft drinks need thicker bottles due to carbonation and the bottling process.
Bottled water containers are fully recyclable, including the caps. They are the most commonly recycled PET plastic containers in curbside programs, making up 53% of all PET bottles collected. In comparison, soda bottles account for only 16% of PET bottles collected.
“Drinking water — whether it’s tap, bottled, or filtered — should always be encouraged,” said Culora. “With the high rates of obesity, diabetes, and heart disease in our on-the-go society, bottled water provides a safe, healthy, and, as is noted in your story, convenient beverage choice.”
For more information, visit the International Bottled Water Association.
Survey Methodology:
The 2024 survey was conducted online by The Harris Poll from September 16-18, 2024, among 2,069 U.S. adults aged 18 and older.
Image Source: International Bottled Water Association (IBWA)
About International Bottled Water Association (IBWA):
The International Bottled Water Association (IBWA) represents the No. 1 packaged beverage in the United States: bottled water. Founded in 1958, IBWA’s members include U.S. and international bottlers, distributors, and suppliers, with the majority being small, locally owned businesses. These companies not only provide healthy hydration but also create valuable jobs in their communities. IBWA advocates for the safety, quality, and availability of bottled water, working closely with the U.S. Food and Drug Administration (FDA) to ensure high standards are met. As a trusted source of information, IBWA promotes environmental sustainability and healthy hydration choices, while serving as the voice of the bottled water industry.
Share this Story
Related Posts